Transamerica Asset Management, Inc. 2024 Mid-Year Market Outlook

Transamerica Asset Management, Inc.
2024 Mid-Year Market Outlook
Tom Wald, CFA®
Chief Investment Officer
Transamerica Asset Management, Inc.
2024 and 2025 year-end forecasts
| FORECASTS | Year-End 2024 | Year-End 2025 |
|---|---|---|
| CY U.S. GDP Growth | 2.00% | 2.50% |
| Core CPI Inflation | 3.00% | 2.60% |
| Core PCE Inflation | 2.40% | 2.20% |
| Slope of Yield Curve (3 Month–10 Year) | Inverted | Upward |
| Federal Funds Rate (Lower Bound) | 4.75% | 4.00% |
| 10-Year U.S. Treasury Bond Yield | 4.25% | 4.25% |
| S&P 500® | 5,800 | 6,300 |
| PORTFOLIO POSITIONING | |
|---|---|
| Asset Allocation | Balanced Stocks/Bonds (60/40) |
| Optimal Spots on Yield Curve | 6–9 Years 1–2 Years |
| Fixed Income | Intermediate Term, Investment Grade (6–9 Years) |
| U.S. Stocks | Large-Cap Growth through 2024 Large-Cap Value in mid-2025 |
| International Stocks | Developed Markets, Europe, Japan |
Click the (i) below to read a text description of this chart or download a PDF
Transamerica Asset Management's economic and market forecasts for 2024 and 2025. They include positive GDP growth of 2% in CY 2024 and 2.5% in CY 2025. A lower bound, year-end federal funds rate of 4.75% by year-end 2024, and 4% by year-end 2025. A 10-year Treasury bond yield of 4.25% for year-end 2024 and year-end 2025. A price target of 5,800 on the S &P 500 for year-end 2024 and 6,300 for year-end 2025. In terms of portfolio positioning, the environment is one that looks to be favorable for balanced (60/40) stock/bond allocations. Within equities, large-cap growth looks well positioned, and in fixed income intermediate-term, investment-grade bonds with 6–9 year maturity ranges.
U.S. economy
The U.S. economy is likely to conclude the year with cumulative gross domestic product (GDP) growth of about 2%, which we would view as an environment favorable for both stocks and bonds. We see this growth as more weighted toward the second half of the year and potentially accelerating into calendar year CY 2025 based on lower rates of inflation, Federal Reserve rate cuts, and rising corporate earnings growth. We believe inflation will continue to decline with consumer price index (CPI) and personal consumption expenditures (PCE) core measures combining to average below 3% by year-end and further declining into 2025.

GDP growth trends
Annualized GDP growth, 1Q 2023–1Q 2024
Source: GDP — Bureau of Economic Analysis, as of 3/31/24, third release 6/27/24
Following a slowing pace of GDP growth in 1Q 2024, we see a combination of economic headwinds and tailwinds at force with one another for the remainder of the year. Headwinds include the ongoing impact of previous Federal Reserve rate hikes, declining consumer savings rates, and rising credit card debt. Tailwinds include potentially declining rates of inflation, Federal Reserve rate cuts, and rising corporate earnings growth. On balance, we see a net advantage for the tailwinds resulting in positive economic growth for CY 2024 of about 2%, which we would view as a favorable environment for both stocks and bonds.
Click the (i) below to read a text description of this chart or download a PDF
Transamerica Asset Management's economic and market forecasts for 2024 and 2025. They include positive GDP growth of 2% in CY 2024 and 2.5% in CY 2025. A lower bound, year-end federal funds rate of 4.75% by year-end 2024, and 4% by year-end 2025. A 10-year Treasury bond yield of 4.25% for year-end 2024 and year-end 2025. A price target of 5,800 on the S&P 500 for year-end 2024 and 6,300 for year-end 2025. In terms of portfolio positioning, the environment is one that looks to be favorable for balanced (60/40) stock/bond allocations. Within equities, large-cap growth looks well positioned, and in fixed income intermediate-term, investment-grade bonds with 6–9 year maturity ranges.

Job market strength
Monthly new payrolls, June 2023–May 2024
Source: Bureau of Labor Statistics, as of 5/31/24
A major reason we believe positive economic growth can continue despite the presence of headwinds is the extremely strong jobs growth experienced over the past year. While we expect this rate of employment gains to slow in the months ahead, we believe the foundation of this existing labor base to be strong enough to sustain positive consumer spending into 2025.
Click the (i) below to read a text description of this chart or download a PDF
Employment growth has been strong over the past year, which should sustain positive consumer spending into 2025. According to the U.S. Bureau of Labor Statistics, new jobs added to the economy since June 2023 have totaled 2.76 million, for a 12-month average of 230,000. The most recent 6-month average is 255.000 and most recent 3-month average is 230,000.

Consumer headwinds
Rising credit card debt and declining savings rate
As of 4/30/24; Revolving Consumer Credit Outstanding. Source: Federal Reserve; Household Savings Rate Source: Bureau of Economic Analysis
We view perhaps the predominant headwind on consumer spending as being the combination of increasing aggregate consumer credit card debt and declining monthly household savings rates. This cross correlation of less money to spend and more bills to pay is potentially a future drag on economic growth in the year ahead.
Click the (i) below to read a text description of this chart or download a PDF
Since March 2021 the average monthly household savings rate has declined from over 20% to 3.6% as of May 2024. Aggregate consumer credit card debt has increased more than 30% to $1.3 trillion over this same time frame. This cross correlation of less money to spend and more bills to pay is potentially a future drag on economic growth in the year ahead.

Inflation trends
Key inflation rates, January 2021–May 2024
CPI Source: Bureau of Labor Statistics, as of 5/31/24; PCE Source: Bureau of Economic Analysis, as of 4/30/24
After we saw encouraging inflation trends throughout 2023, closely watched measures flatlined through the first three months of the year, as seen in the year-over-year CPI core and PCE core inflation rates. After falling impressively over the previous 12 months, these two metrics declined by only 0.1% from January through March to 3.8% and 2.8%, respectively. Since then, core CPI has shown some renewed movement to 3.4% for May. Our expectation is inflation will likely resume its downward trajectory in 2H 2024, perhaps to the lower 3% range for core CPI and into the lower 2% range for core PCE. We believe such a scenario would provide the Fed with enough of a downward trajectory to potentially reduce interest rates in 4Q 2024, which we would view as favorable for the economy and the markets.
Click the (i) below to read a text description of this chart or download a PDF
This is a chart of four inflation indexes — the consumer price index, or CPI, CPI core (ex food and energy components), personal consumption expenditures, or PCE, and PCE core. Each one has declined materially since their high points in 2022. CPI peaked at a year-over-year rate of 9.1% in June 2022 and for May 2024 is at 3.3%. CPI core peaked at 6.6% in September 2022 and declined to 3.4% in May 2024. PCE peaked at 7.1% in June 2022 and has declined to 2.7% in May 2024. PCE core peaked at 5.6% in February 2022 and has declined to 2.8% in May 2024.
Market Pulse summary: U.S. economy
We believe the U.S. economy is likely to achieve approximately 2% GDP growth in CY 2024 with a potential acceleration in 2025, thereby providing a favorable environment for stocks and bonds. We see inflation continuing to mitigate into the sub-3% range by year-end when averaging CPI and PCE core measures.
Fixed income
We believe the door remains open at the Federal Reserve for a pair of 0.25% rate cuts in the 4Q, concluding the year with a federal funds rate target range of 4.75%–5.00%. We also see the Fed further reducing rates thereafter and potentially finishing CY 2025 with a federal funds rate target range of 4.00%–4.25%. We expect the yield curve to incrementally flatten to a less inverted slope by year-end 2024 before normalizing back to an upward slope in 2025. This expectation is based in large part on the 10-year Treasury bond yield concluding the year at 4.25% and maintaining that level in 2025. Against this backdrop, we view intermediate-term, investment-grade bonds as providing a strong risk-reward profile for bond investors.

Forecasted path of federal funds rate
As of 6/12/24. Source: Fed Funds Target Rate: Federal Reserve Board of Governors; Forecast: Transamerica Asset Management
It is our best judgment at this time that the Fed does indeed want to normalize rates lower but needs first to see further progress on declining inflation. In our view, this is unlikely to occur until 4Q 2024. However, at that point we could see two, quarter-point rate cuts in November and December, taking the fed funds rate down to a target range of 4.75%–5.00%, one-half of 1% lower than its current range. Looking into CY 2025, we believe the Fed is likely to continue reducing rates to perhaps a target range on the fed funds rate of 4.00%–4.25% as inflation further falls.
Click the (i) below to read a text description of this chart or download a PDF
The Federal Reserve raised the federal funds rate by 5.25% from March 2022 to July 2023, taking it to a target range of 5.25%–5.50%. Transamerica Asset Management, Inc. has forecasted two, quarter-point rate cuts in 4Q 2024, taking the federal funds rate down to a target range of 4.75%–5.00% by year-end 2024. In 2025, Transamerica Asset Management, Inc. believes the Fed will continue reducing rates potentially taking the federal funds target range down to 4.00%–4.25%.

Real rate of interest
Federal funds rate minus core rate of inflation, December 2021–June 2024
Source: Federal Reserve Board of Governors, as of 4/30/24
A reason why we believe a pair of rate cuts could still be on the table by year-end is the current level of the inflation-adjusted real rate of interest, as calculated by the upper bound fed funds rate less PCE core inflation, currently at 2.7% (5.5%–2.8%). We believe the Fed likely views this as a longer-term restrictive level but is still looking for more supportive inflation data in the months ahead before taking policy action in reducing the target range on the fed funds rate. Looking out to year-end 2025, we believe about a 2% real rate would be viewed as rationale by the Fed, based on a potential level of PCE core inflation at about 2.2% and therefore consistent with a fed funds target range of 4.00%–4.25%.
Click the (i) below to read a text description of this chart or download a PDF
This chart shows the change in the real rate of interest since inflation began to rise materially in 2021. The real rate of interest is calculated by subtracting the federal funds rate (upper bound) from the core rate of inflation (PCE core). This real rate has changed from -5.3% in December 2021 to +2.7% in June 2024. A positive real rate of interest is considered to be an advantageous condition in regard to fighting inflation.

History of inverted yield curves
3-month to 10-year Treasury bond yield curve, 1962–2024
As of 6/13/24; Source: Bloomberg
The previous nine inverted curves dating back to 1966 have averaged a tenure of 11 months, with a range of five to 18 months. The current 3-month to 10-year inverted yield curve, in place since October 2022, is now in its 21st month, surpassing the longest previous inverted curve of December 1978–May 1980.
Click the (i) below to read a text description of this chart or download a PDF
This chart displays the tenures of the previous nine 3-month to 10-year inverted Treasury bond yield curves since 1966. In total, they have averaged a tenure of 11 months, with a range of five to 18 months. The current 3-month to 10-year inverted yield curve, in place since October 2022, is now in its 21st month, surpassing the longest previous inverted curve of December 1978–May 1980.

Adapting to a changing yield curve
As of 6/13/24; Source: Bloomberg
When taking this history into account, as well as inflation trends over the past two years, we believe the current 3-month to 10-year Treasury yield curve is likely to flatten to a less inverted slope between now and year-end 2024 before fully normalizing back to an upward slope during 2025. Given the prospect of two rate cuts in 4Q, we see the 3-month Treasury yield dropping to 4.75%, with the 10-year yield settling out at about 4.25%. We would then expect the yield curve to eventually normalize to an upward slope following more rate cuts during CY 2025 while the 10-year yield holds steady.
In this changing environment, we see two viable approaches for fixed income investors. Investors may consider intermediate-term bonds in the 6–9 year maturity range to lock in yields at or near multiyear highs while mitigating reinvestment rollover risk at the short end of the curve as well as duration-based price risk at the longer end (10 years or greater). Investors may also consider the highest possible yields at the short end of the curve (1–2 years). However, we recognize there is the risk of rolling over those shorter maturities into lower yields if the Fed continues easing monetary policy in 2025, as we believe will likely be the case.
Click the (i) below to read a text description of this chart or download a PDF
Transamerica Asset Management Inc. believes the Treasury bond yield curve is likely to flatten to a less inverted slope by the end of 2024 and back to an upward slope in 2025. Under this changing environment, intermediate-term bonds in the 6–9 year maturity range and short-term bonds in the 1–2 year maturity range appear well positioned. Intermediate-term bonds in the 6–9 year maturity range allow bond investors to lock in yields at or near multiyear highs while mitigating reinvestment rollover risk at the short end of the curve as well as duration-based price risk at the longer end (10 years or greater). We also see rationale in owning the highest possible yields at the short end of the curve (1–2 years); however, recognizing there is risk of rolling over those maturities into lower yields if the Fed continues easing monetary policy in 2025, as we believe will likely be the case.

A and BBB rated corporate bond yields, January 2021–June 2024
Index; BBB rated bond yields represented by the yield to worst on the US Aggregate Bond: BBB Index; Source: Bloomberg, as of 6/12/24
We continue to be drawn toward intermediate-term, investment-grade bonds as being perhaps the best segment of the fixed income markets from a risk-reward standpoint. Yields on A and BBB rated corporate bonds are now close to three times higher than at the start of 2021, before the higher inflation and rising interest rate environment began. Therefore, as inflation and interest rates potentially further normalize to some extent in the year or two ahead, the case to lock in these yields on investment-grade bonds is likely a strong one, in our view.
Click the (i) below to read a text description of this chart or download a PDF
Investment-grade bonds are offering yields close to multiyear highs and appear well positioned in the current market environment. Yields on A-rated and BBB-rated corporate bonds are now close to three times higher than at the start of 2021 before the higher inflation and rising interest rate environment began. As of June 12, 2024, BBB-rated corporate bonds were averaging yields of 5.61% and A-rated bonds 5.28%, according to the US Aggregate Bond A Index and the US Aggregate Bond BBB Index.

Investment-grade and high-yield credit spreads, January 2021–June 2024
High-yield credit spreads represented by the OAS for the ICE BofA US High Yield Index; investment-grade credit spreads represented by the OAS for the ICE BofA US Corporate Index, Source: ICE Indexes, as of 6/13/24
While we view the ongoing credit environment as relatively benign, we still prefer investment-grade bonds to high yield due to the historically tight credit spreads currently on high-yield bonds versus comparable maturity U.S. Treasury bond yields. In the event of some economic slowing in the months ahead, we see investment-grade bonds as less likely to experience credit spread widening and are therefore the preferable choice from a risk-reward standpoint.
Click the (i) below to read a text description of this chart or download a PDF
Transamerica Asset Management, Inc. believes that given current credit spreads versus comparable maturity Treasury bonds, investment-grade bonds are preferable to high yield from a risk-return standpoint. As of June 13, 2024, the option-adjusted spread for the ICE B of A US High Yield Index was 3.2%, and the option-adjusted spread for the ICE B of A US Corporate Index was 0.92%.
Market Pulse summary: Fixed income
We believe the year ahead will remain a favorable one for intermediate-term, investment-grade bonds against a backdrop of Federal Reserve rate cuts, a flattening and eventually upward sloping yield curve, and a relatively benign credit environment.
U.S. stocks
In our judgment, the equity markets can achieve annualized, double-digit total returns over the next two years. Our year-end 2024 price target on the S&P 500® is 5,800, with prospects to reach 6,300 by the conclusion of 2025. Key catalysts for stocks over this time include Fed rate cuts, declining inflation, and, most importantly, rising corporate earnings growth. We continue to prefer growth stocks over value for the upcoming one-year time frame but thereafter a case can begin to be made for value over the longer term.
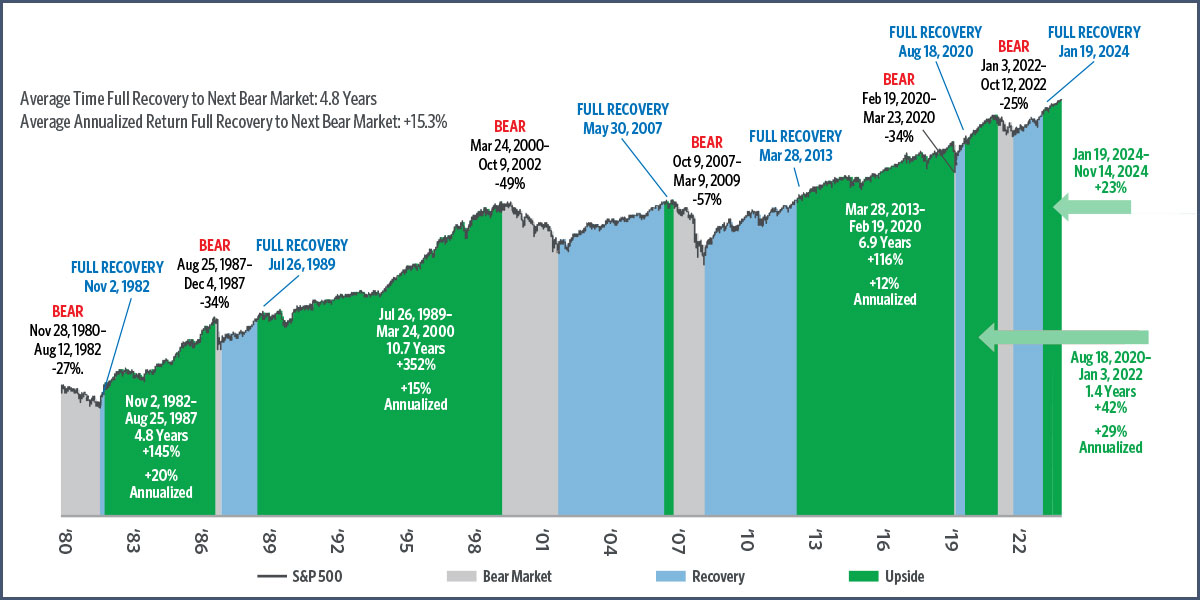
Historical returns following bear market recoveries, 1980–2024
S&P 500 price returns
Source: Bloomberg, as of 6/13/2024
Indexes are unmanaged and an investor cannot invest directly in an index. Past performance does not guarantee future results.
The run in U.S. stocks since the depths of the recent bear market has been substantial and impressive. However, we believe the combination of rising corporate earnings growth and market history following the full recoveries of bear markets (similar to what markets experienced in January), and the prospects of lower inflation and Federal reserve rate cuts suggests U.S. equities are capable of double-digit, annualized total returns between now and the end of CY 2025.
In looking at the previous five bear markets (defined as a 20% or worse decline in the S&P 500) dating back to 1980, stock investors have typically benefitted from owning stocks immediately following the full recovery of those bear market losses. Such was the case after full recoveries of S&P 500 bear market losses in November 1982, July 1989, March 2013, and August 2020, all of which proceeded to post extremely strong returns until the next bear market.
The only bear market deviating from this profile over the past 44 years was the full recovery of the 2000–2002 bear market, which then soon rolled into the global financial crisis bear market in 2007, now viewed by history as a “double top” in which the S&P 500 did not confirm its total recovery at higher levels. The average tenure following these five previous bear market complete price recoveries until the start of the next bear market was 4.8 years, with average annualized price gains of better than 15%.
Click the (i) below to read a text description of this chart or download a PDF
In looking back at the past five bear markets (defined as a 20% or worse decline in the S&P 500), history infers that stocks are likely to post above-average returns over multiyear time frames following complete stock loss recoveries of those bear markets. Since 1980, there have been six bear markets, including the most recent one that began in January 2022. In four of those previous bear markets experiencing full price loss recoveries in November 1982, July 1989, March 2013, and August 2020, the S&P 500 went on post above-average annualized price gains until the next bear market. On average, following these full price recoveries, the average tenure until the next bear market was 4.8 years and these time frames averaged annualized price gains of more than 15%.

Bear market recovery
S&P 500, January 2022–June 2024
Source: Bloomberg. as of 6/13/24
The most recent bear market, beginning in January 2022, reached a complete price recovery on the S&P 500 in January 2024 and appears to have confirmed itself at higher levels since that time. We believe catalysts for stocks in the year or two ahead include rising economic and corporate earnings growth, declining rates of inflation, and Federal Reserve rate cuts. All of this we view as consistent with price targets on the S&P 500 of 5,800 for year-end 2024 and 6,300 for year-end 2025.
Click the (i) below to read a text description of this chart or download a PDF
The most recent bear market that began on January 3, 2022, for the S&P 500 reached its low point on October 12, 2022, before fully recovering those price losses on January 18, 2024. Transamerica Asset Management Inc. believes reasonable price targets on the S&P 500 are 5,800 for year-end 2024 and 6,300 for year-end 2025.

Corporate earnings growth
S&P 500 net operating income annualized and estimated growth, 2020–2025
Historical EPS Source: FactSet Earnings Insight; as of June 14, 2024; Estimate Source: Transamerica Asset Management as of June 14, 2024
Of these catalysts, we view the most meaningful as being rising corporate earnings growth. When looking at S&P 500 net operating income estimates for 2024 and 2025, it appears as though, following three years of close to flat earnings from 2021–2023, corporate profits could be primed for a notable breakout over these next two calendar years in the 11%–14% range. Given these expectations and what we believe could be some degree of upside to CY 2025 estimates amid a declining rate environment, we believe it is fair to anticipate annualized total returns on stocks over the upcoming year or two to be similar to earnings growth, which is also consistent with our price targets on the S&P 500 of 5,800 for year-end 2024 and 6,300 for year-end 2025.
Click the (i) below to read a text description of this chart or download a PDF
This chart displays the historical results of S&P 500 net operating income since CY 2020 and forward estimates for CY 2024 and CY 2025 as gathered, weighted, and calculated by FactSet Earnings Insight as of June 14, 2024. Following three years of close to flat earnings growth from 2021–2023 ($208–$220), expectations are for S&P 500 net income to rise by 11% to $245 in CY 2024 and by 14% to $279 in CY 2025. Rising corporate earnings growth could be a major catalyst for stocks to achieve double-digit annualized total returns through the end of CY 2025.

Growth vs. value — comparative returns
Russell 1000® Growth vs. Russell 1000 Value, May 2014–May 2024
Source: Bloomberg, as of: 5/31/24
We view the current market environment as one that can be favorable for growth and value stocks. Over the past decade, growth stocks have dramatically outperformed value stocks, as seen in this total return comparison of Russell 1000® Growth versus Russell 1000 Value indexes.
Click the (i) below to read a text description of this chart or download a PDF
Growth stocks have materially outperformed value over the past decade, as seen in the comparative returns of Russell 1000 Growth versus Russell 1000 Value. From May 2014–May 2024, the Russell 1000 Growth Index has posted a cumulative total return of 333% versus 128% for the Russell 1000 Value Index.

Growth vs. value — comparative valuations
Russell 1000 Growth vs. Russell 1000 Value
Price to trailing 12-month earnings multiple, May 2014–May 2024
Source: Bloomberg, as of 5/31/24
During this time, growth stocks have also traded at historically high price-earnings valuation differentials versus value stocks. Therefore, a case clearly exists for a longer-term regression to the mean and a potential outperformance cycle for value stocks.
Click the (i) below to read a text description of this chart or download a PDF
This chart displays the widening valuation differentials between the Russell 1000 Growth and Russell 1000 Value now at historically high levels. As of the end of May 2024, the Russell 1000 Growth Index maintained a price to trailing 12-month ratio of 31.2 times versus 17.2 times for the Russell 1000 Value Index.

Growth vs. value following start of rate cutting
Source: Bloomberg
Indexes are unmanaged and an investor cannot invest directly in an index. Past performance does not guarantee future results.
However, at this point in the economic and Federal Reserve monetary policy cycle, we believe there is still likely to be one more relative leg up for growth stocks in the year or so ahead. In reviewing the conclusions of past historical Fed tightening cycles, there are three worth noting that, in our view, are most similar to the current environment. They are July 2019, July 1995, and June 1989, all instances in which the Fed cut rates for the first time following the conclusion of a rate hike tightening cycle. In each case, stocks experienced strong returns with growth outperforming value in the following year.
Click the (i) below to read a text description of this chart or download a PDF
This is a look at three historical Fed tightening cycles and how stocks performed following the first rate cut following their conclusions. These rate cuts occurred in July 2019, July 1995, and June 1989. In each case, stocks performed quite well in aggregate for the year to follow with the Russell 1000 Growth Index outperforming the Russell 1000 Value Index. This infers there could be another leg of growth outperforming value before valuation differentials begin to meaningfully converge.
Market Pulse summary: U.S. stocks
Following the complete bear market recovery achieved in January 2024, we believe stocks continue to be well positioned for more upside based mostly on expectations of double-digit corporate earnings growth in CY 2024 and CY 2025. We believe growth stocks are well positioned for the year ahead, though a longer-term case for value is also likely to gain traction.
International stocks
International stocks could be positioned for some degree of catch up versus their U.S. counterparts, as valuation measures have hit historically wide differentials. Against this backdrop, we see potential catalysts for international developed stocks as including a sharper decline of inflation in the eurozone combined with corresponding European Central Bank (ECB) rate cuts and an improving market environment in Japan.

MSCI EAFE vs. S&P 500 — comparative returns
MSCI EAFE vs. S&P 500, May 2014-May 2024
As of 5/31/2024. Source: Bloomberg
Indexes are unmanaged and an investor cannot invest directly in an index. Past performance does not guarantee future results.
Over the past 10 years, the MSCI EAFE has materially underperformed the S&P 500, representative of a lost decade for international developed stocks versus their U.S. counterparts.
Click the (i) below to read a text description of this chart or download a PDF
This chart displays the 10 years ended May 2024 in which the S&P 500 has provided dramatically higher total returns versus the MSCI EAFE Index. Over this time frame, the S&P 500 posted a cumulative total return of 230% versus 53% for the MSCI EAFE Index.

MSCI EAFE vs. S&P 500 — comparative valuations
MSCI EAFE vs. S&P 500 Trailing 12-Month P/E Ratios, May 2014-May 2024
Source: Bloomberg
Indexes are unmanaged and an investor cannot invest directly in an index. Past performance does not guarantee future results.
Looking forward, we believe there could be some degree of catchup in relative performance for international developed stocks given historically wide valuation differentials between the S&P 500 and MSCI EAFE indexes. This could allow for certain catalysts to come to the forefront for international developed stocks. These could include eurozone inflation, which has fallen at a faster pace than in the U.S., corresponding ECB rate cuts, and a more shareholder-focused market environment in Japan.
Click the (i) below to read a text description of this chart or download a PDF
This chart displays that as of May 2024, the MSCI EAFE Index maintains a lower price to trailing 12-month earnings ratio of 14.9 times versus 23.1 times for the S&P 500. Catalysts for the MSCI EAFE to potentially close this valuation gap could include declining eurozone inflation, corresponding European Central Bank rate cuts, and an improving market environment in Japan.

Eurozone CPI, October 2022–June 2024
Eurozone CPI Source: Eurostat; as of 5/31/2024; ECB Deposit Facility Rate, Source: European Central Bank as of 6/13/2024
Eurozone inflation has declined rapidly from its cycle peak almost two years ago. This descent has resulted in the ECB cutting key interest rates for the first time since 2019. We would view declining inflation and further ECB rate cuts as potential tailwinds for eurozone stocks in the year ahead
Click the (i) below to read a text description of this chart or download a PDF
On this chart, it can be seen that, since October 2022, eurozone CPI Inflation has declined from an annualized rate of 10.6% to 2.6% as of May 2024, and that in June 2024 the European Central Bank reduced its deposit facility rate from 4.00% to 3.75% representing its first rate reduction since 2019.

Improving environment in Japan
Nikkei 225, December 1989–June 2024
Source: Bloomberg, as of: 6/13/24
Indexes are unmanaged and an investor cannot invest directly in an index. Past performance does not guarantee future results.
Stocks in Japan also appear to be showing renewed promise as seen in the Nikkei 225 Index recently eclipsing its previous record high dating back to December 1989. In our view, much of this is being driven by a corporate renaissance of sorts in which the Tokyo Stock Exchange has taken on new listing recommendations, encouraging companies trading below book value to submit plans as to how they will generate higher profitability and more efficient balance sheet management. This is likely, in our view, to result in more optimal capital redeployment and higher returns on equity over time for Japan stocks.
Click the (i) below to read a text description of this chart or download a PDF
In February 2024, the Nikkei 225 Index eclipsed its previous 34-year high achieved back in December 1989, perhaps indicative of an improving market environment in Japan.
Market Pulse summary: International stocks
International developed stocks could be positioned for some degree of catch-up versus U.S. equities in the year ahead based on current valuation differentials and improving market environments within the eurozone and Japan.
Wild cards
While the upcoming November elections promise to comprise a good bit of drama mostly driven by what appears will be closely fought contests for party control of the White House, Senate, and House of Representatives, we believe markets will likely respond most favorably to split leadership across the executive and legislative branches. Post election, focus will likely quickly center on future tax legislation, as various components within the Tax Cuts and Jobs Act of 2017 are set to expire by year-end 2025.
Portfolio positioning mid-year 2024
- We favor a balanced allocation of stocks and bonds given what we believe to be an economic and market environment in the year ahead conducive to owning both asset classes. Specifically, we believe 60/40 stock-bond allocations are well prepared to deliver capital appreciation and income.
- Within stocks, we favor large cap over mid and small cap, utilizing proportional market cap weightings.
- We view the current market environment as being favorable for growth and value stocks; however, for the year ahead we continue to lean toward growth due in large part to declining inflation and upcoming Fed rate cuts, which historically has inferred stronger intermediate-term performance for growth. By mid-year 2025, value stocks could be well positioned to begin closing valuation gaps with growth.
- International developed stocks appear positioned to potentially gain back some ground on U.S. stocks driven by historically wide valuation differentials, declining inflation and rate cuts in Europe, and an improving and more shareholder-focused market environment in Japan.
- In fixed income, given what we believe is likely to be an incremental flattening of the yield curve through the remainder of the year and the ultimate return to an upward slope in 2025, we most favor locking in yields on intermediate-term, investment-grade bonds (6- to 9-year maturities), though we also see rationale in owning higher-yielding, short-term bonds (1–2 years).
- From a credit perspective, we favor investment-grade bonds over high yield, as tight credit spreads for high-yield bonds could present a higher risk of widening should the economy encounter some slowing of growth in the months ahead.

This strategy overview is intended to illustrate major themes for the identified period. No representation is being made that any particular account, product, or strategy will engage in any or all of these themes.

About the author
Tom is the Chief Investment Officer of Transamerica Asset Management, Inc., the mutual fund arm of Transamerica. Tom has more than 30 years of investment management experience and has managed large mutual fund portfolios and separate accounts.
As a member of the senior management team, Tom heads Transamerica Asset Management’s thought leadership efforts and provides perspectives to advisors, clients, the media, and general public. He writes and publishes Transamerica’s Market Outlook and other relevant commentary. He also heads Transamerica’s mutual fund sub-adviser selection and monitoring process, as well as product management. Tom holds a bachelor's degree in political science from Tulane University and an MBA in finance from the Wharton School at the University of Pennsylvania.
Learn more about our mutual funds and get the latest advisor resources.
Glossary & Index Definitions
CPI: Consumer price index
ECB: European Central Bank
EPS: Earnings per share
GDP: Gross domestic product
PCE: Personal consumption expenditures
The Bloomberg US Aggregate Bond Index measures investment grade, U.S. dollar-denominated, fixed-rate taxable bonds, including Treasurys, government related and corporate securities, as well as both mortgage- and asset-backed securities.
The Bloomberg US High Yield Index covers the universe of fixed rate, non-investment grade debt. Eurobonds and debt issues from countries designated as emerging markets (sovereign rating of Baa1/BBB+/BBB+ and below using the middle of Moody’s, S&P, and Fitch) are excluded, but Canadian and global bonds (SEC-registered) of issuers in non-EMG countries are included.
The Bloomberg Municipal Index consists of a broad selection of investment-grade general obligation and revenue bonds of maturities ranging from one year to 30 years. It is an unmanaged index representative of the tax-exempt bond market.
The Bloomberg US Corporate Investment Grade Index is an unmanaged index consisting of publicly issued U.S. Corporate and specified foreign debentures and secured notes that are rated investment grade (Baa3/BBB or higher) by at least two ratings agencies, have at least one year to final maturity and have at least $250 million par amount outstanding. To qualify, bonds must be SEC-registered.
The 10-Year U.S. Treasury bond is a U.S. Treasury debt obligation that has a maturity of 10 years.
The Dow Jones Industrial Average is a price-weighted average of 30 actively traded blue-chip U.S. stocks.
The federal funds rate refers to the target interest rate range at which commercial banks borrow and lend their excess reserves to each other overnight, which is set by the Federal Open Market Committee.
The MSCI EAFE Index (Europe, Australasia, Far East) is a free float-adjusted market capitalization index that is designed to measure the equity market performance of developed markets, excluding the U.S. & Canada.
The MSCI Emerging Markets Index is a free float-adjusted market capitalization index that is designed to measure equity market performance in the global emerging markets.
The Russell 1000 Growth Index® measures the performance of those Russell 1000 companies with higher price-to-book ratios and higher forecasted growth values.
The Russell 1000 Value Index® measures the performance of those Russell 1000 companies with lower price-to-book ratios and lower forecasted growth values.
The Russell 2000 Index® measures the performance of the 2,000 smallest companies in the Russell 3000 Index.
The S&P 500 Index is widely regarded as the best single gauge of the U.S. equities market. The index includes a representative sample of 500 leading companies in leading industries of the U.S. economy. The S&P 500 Index focuses on the large-cap segment of the market; however, since it includes a significant portion of the total value of the market, it also represents the market.
The Nikkei 225 stock index is a price-weighted index composed of Japan's top 225 blue-chip companies traded on the Tokyo Stock Exchange. The Nikkei is equivalent to the Dow Jones Industrial Average (DJIA) Index in the United States.
Indexes are unmanaged. The figures for the index reflect the reinvestment of all income or dividends, but do not reflect the deduction of any fees or expenses which would reduce returns. Investors cannot invest directly in indexes.
Important Information
Investments are subject to market risk, including the loss of principal. Asset classes or investment strategies described may not be appropriate for all investors.
Past performance does not guarantee future results.
Fixed income investing is subject to credit rate risk, interest rate risk, and inflation risk. Credit risk is the risk that the issuer of a bond won’t meet their payments. Inflation risk is the risk that inflation could outpace a bond’s interest income. Interest rate risk is the risk that fluctuations in interest rates will affect the price of a bond. Investing in floating rate loans may be subject to greater volatility and increased risks.
Equities are subject to market risk meaning that stock prices in general may decline over short or extended periods of time.
Growth stocks typically are particularly sensitive to market movements and may involve larger price swings because their market prices tend to reflect future expectations. Growth stocks as a group may be out of favor and underperform the overall equity market for a long period of time, for example, while the market favors “value” stocks.
Value investing carries the risk that the market will not recognize a security’s intrinsic value for a long time or that an undervalued stock is actually appropriately priced.
Investments in global/international markets involve risks not associated with U.S. markets, such as currency fluctuations, adverse social and political developments, and the relatively small size and lesser liquidity of some markets. These risks may be greater in emerging markets.
The COVID-19 pandemic has caused substantial market disruption and dislocation around the world including the U.S. Economies and financial markets throughout the world are increasingly interconnected. Economic, financial, or political events, trading and tariff arrangements, terrorism, technology and data interruptions, natural disasters, and other circumstances in one or more countries or regions could be highly disruptive to, and have profound impacts on, global economies or markets.
The information included in this document should not be construed as investment advice or a recommendation for the purchase or sale of any security. This material contains general information only on investment matters; it should not be considered as a comprehensive statement on any matter and should not be relied upon as such. The information does not take into account any investor’s investment objectives, particular needs, or financial situation. The value of any investment may fluctuate. This information has been developed by Transamerica Asset Management, Inc., and may incorporate third-party data, text, images, and other content to be deemed reliable.
Comments and general market-related projections are based on information available at the time of writing and believed to be accurate; are for informational purposes only, are not intended as individual or specific advice, may not represent the opinions of the entire firm and may not be relied upon for future investing. Investors are advised to consult with their investment professional about their specific financial needs and goals before making any investment decisions.
Transamerica Asset Management, Inc. (TAM) is an SEC-registered investment adviser that provides asset management, fund administration and shareholder services for institutional and retail clients. The funds advised and sponsored by TAM include Transamerica Funds and Transamerica Series Trust. Transamerica Funds and Transamerica Series Trust are distributed by Transamerica Capital, Inc. (TCI), member FINRA. TAM is an indirect wholly owned subsidiary of Aegon Ltd., an international life insurance, pension, and asset management company.
1801 California Street, Suite 5200, Denver, CO 80202, USA