
Transamerica Asset Management, Inc. 2024 Market Outlook
Transamerica Asset Management, Inc.
2024 Market Outlook
Tom Wald, CFA®
Chief Investment Officer
Transamerica Asset Management, Inc.
2024 year-end forecasts
| Fed Funds Rate (Lower Bound) | 4.25% |
|---|---|
| 10-Year U.S. Treasury Bond Yield | 4.25% |
| Path of Yield Curve (3 month-10 Year) | From Inverted to Flat Slope |
| Optimal Spot on Yield Curve | 6-9 years |
| S&P 500® | 5,000 |
| CY 2024 U.S. GDP Growth | Flat Growth |
| Path of U.S. Economy | Mild recession in 1H followed by 2H recovery |
| Top Performing Fixed Income | Intermediate Term Investment Grade (6-9 years) |
| Runner-Up | Intermediate Term High Yield (6-9 years) |
| Top Performing Equity | Large-Cap Growth |
| Runner-Ups | Mid-Cap Growth, Small-Cap Growth |
| Top Performing International | Developed Markets, Europe, Japan |
Click the (i) below to read a text description of this chart or download a PDF.
U.S. economy
Leading indicators point toward economic slowing, and we continue to believe a mild recession is likely in 1H 2024. Reasons for this include the lagging impacts of past Federal Reserve rate hikes, recently escalated long-term interest rates, depleting levels of consumer savings, mounting credit card debt, and the resumption of student loan payments. Following negative growth in 1H 2024, we expect the economy to rebound in 2H, finishing the year at about flat growth. We see core rates of inflation continuing to decline and potentially reaching the 3% level by mid-year. All considered, we believe markets are well prepared to handle an economic downturn based on its widely anticipated nature and the likelihood of a recovery in the second half of the year.
Heading toward a downturn
Annualized GDP Growth 1Q 2022-4Q 2023 (Estimated)

Source: GDP Bureau of Economic Analysis, as of 9/30/23, second estimate released 11/29/23; Forecast - Federal Reserve Bank of Atlanta, as of 11/30/23
Click the (i) below to read a text description of this chart or download a PDF.
Despite recent economic strength, as exemplified by 3Q gross domestic product (GDP) growth of 5.2%, it is our assessment that leading economic indicators point to a slowdown during the early months of 2024. At the forefront of these factors is the lagging effects of 5.25% of Federal Reserve rate hikes that have occurred since March 2022. In our judgment, it could take 12–18 months for each rate hike to fully filter through the economy, meaning there could be approximately 375 basis points of previous Fed rate hikes yet to have their impact completely felt.
Fed rate hikes still yet to fully impact economy
Fed Rate Hikes March 2022-July 2023

Source: Federal Reserve Board of Governors, Transamerica Asset Management. As of 11/30/23
Click the (i) below to read a text description of this chart or download a PDF
In addition, escalated longer-term rates, as seen in the U.S. Treasury 10-year yield, have recently reached multiyear highs and are spilling over into the credit and mortgage markets. This is also likely to create economic impact in 2024.
Impact of longer-term interest rates
10-Year Treasury Yield and 30-Year Fixed Mortgage February 2022-November 2023

As of 11/30/23 Source, 10-Year US Treasury Yield: Bloomberg; Source, 30-Year Average Fixed Mortgage Rate: BankRate.com
Click the (i) below to read a text description of this chart or download a PDF.
Other leading indicators include depleting levels of consumer savings, mounting credit card debt, and the resumption of student loan payments. These factors could soon begin negatively impacting consumer spending that has been a key driver of recent economic strength seen over the past year.
Consumer headwinds
Rising Credit Card Debt and Declining Savings Rate

Household Savings Rate as of 10/31/23, Source: Bureau of Economic Analysis; Revolving Consumer Credit Outstanding as of 9/30/23, Source: Federal Reserve
Click the (i) below to read a text description of this chart or download a PDF.
Further signifying risk of slowing and potentially negative economic growth in 1H 2024 is the ongoing decline in the Conference Board’s Leading Economic Index (LEI), which is a series of 10 economic, market, and consumer metrics with an established history of turning negative prior to broad-based downturns. This index has been in decline since March 2022 — for 18 consecutive months — and over that time has displayed a cumulative decline of more than -11%. In the past 40 years, the LEI has never fallen by such magnitude without a recession following in the year ahead.
Leading economic indicators inferring recession
Conference Board Leading Economic Index February 2022-October 2023

Source: Conference Board, as of 10/31/23
Click the (i) below to read a text description of this chart or download a PDF.
All considered, we expect an upcoming 1H 2024 economic downturn to be relatively mild and more along the lines of recessions incurred in 1990 and 2001, lasting a couple of quarters and with peak-to-trough GDP declines in the 1–2% range, as opposed to more severe recessions that occurred in 1981 and 2007. We expect the economy, driven by potential rate cuts coming from the Fed in 2H 2024 and the widely anticipated nature by which the pending slowdown has allowed corporations to prepare, will rebound by year-end and finish 2024 at about flat annualized GDP growth.
We continue to be encouraged by recent inflation trends as seen in consumer price index and personal consumption expenditures (PCE) core inflation year-over-year readings now at their lowest levels in more than two years. We believe these core rates of inflation will likely head toward 3% during 1H 2024.
Inflation on the mend
Key Inflation Rates Since January 2021-October 2023

CPI - Source: Bureau of Labor Statistics, as of 10/31/23; PCE - Bureau of Economic Analysis, as of 10/31/23
Click the (i) below to read a text description of this chart or download a PDF.
Market Pulse summary: U.S. economy
Despite the risk of a mild recession during 1H 2024, we would view any equity and credit market weakness during 1H 2024 as potential buying opportunities, as the markets are apt to react favorably to upcoming Fed rate cuts and an improving economic picture in the second half of the year.
Fixed income
We believe the Fed has concluded its rate hike tightening cycle and, based on mitigating inflation and a weakening economy, will likely begin reducing rates around mid-year, potentially finishing CY 2024 with a federal funds rate target range of 4.25–4.50%. We also expect the yield curve to continue normalizing and see the year finishing with a flat slope and therefore believe a realistic year-end level on the 10-year U.S. Treasury rate to also be approximately 4.25%. We view current yields on intermediate-term investment-grade bonds to be opportunistic and see the overall credit environment as more benign than prior to most previous economic downturns.
In our view, there is a high likelihood the most recent Fed tightening cycle has concluded, and no further rate hikes are forthcoming. A major reason for this perspective is the widening increase in the level of real interest rates as measured by the upper bound federal funds rate minus the year-over-year rate on core inflation. Now at a differential of 2% (5.5% upper bound federal funds rate minus 3.5% October PCE core inflation), this represents not only the highest real rate since the Fed began tightening in March 2022 but also a level we view as being sufficiently restrictive in regard to constraining inflation.
Real rate of interest
Fed Funds Rate Minus Core Rate of Inflation December 2021-October 2023

Source: Federal Reserve Board of Governors, as of 10/31/23
Click the (i) below to read a text description of this chart or download a PDF.
Given the Fed’s dramatic pace of rate hikes since March 2022, pending economic weakness, and mitigating levels of inflation, we believe there is a strong probability of federal funds rate cuts in 2H 2024. Odds remain challenged, in our view, that the Fed does much before about mid-year. However, after that point, the Fed could begin an easing cycle consisting of perhaps four quarter-point rate reductions in 2H 2024, taking the federal funds rate down to a target range of 4.25%–4.50%.
Forecasted path of federal funds rate

As of 11/30/23. Source - Fed Funds Target Rate: Federal Reserve Board of Governor. Forecast: Transamerica Asset Management
Click the (i) below to read a text description of this chart or download a PDF.
A major focus for fixed income investors during 2024 will be the changing slope of the Treasury bond yield curve and where to be positioned on it. Here, we see a material flattening of the 3-month to 10-year yield curve throughout the year. This would be consistent with history dating back to 1969 in which yield curves have inverted prior to recession and normalized back toward an upward slope just before or during recession. Given the magnitude of the Fed’s rate hikes since March 2022 and the likelihood of rate cuts not occurring until about mid-year, we expect the 3-month to 10-year Treasury yield curve to fully flatten in the year but not resume an upward slope until perhaps CY 2025. We therefore expect the longer end of the curve to see yields little changed in CY 2024, with the 10-year U.S. Treasury rate concluding the year at approximately 4.25%.
Adjusting for a flat yield curve
Current vs. Forecasted Slope

As of 11/30/23. Source - Data: Bloomberg. Forecast: Transamerica Asset Management
Click the (i) below to read a text description of this chart or download a PDF.
Given this prospective drop in short-term rates and stabilization in longer-term rates to facilitate a flattening yield curve in 2024, we believe the intermediate portion of the curve, in the maturity range of six to nine years, is optimal for fixed income investors. We say this because this area of the curve allows bond investors to lock in yields at or near multiyear highs while mitigating reinvestment rollover risk at the short end of the curve as well as duration-based price risk at the longer end (10 years or greater). We also view the overall credit environment as more benign than prior to most previous economic slowdowns due to the widely anticipated nature of an upcoming recession and stronger corporate balance sheet management in preparation of a downturn.
We are more drawn to investment-grade bonds than high yield in large part due to the ability of investment grade to best weather an economic downturn during 1H 2024. Therefore, as we begin the new year, we view investment-grade bonds as the preferable risk-reward profile, though we do see high yield still generating positive total returns and warranting a smaller portion of fixed income investors portfolios.
Investment-grade yields near multiyear highs
A and BBB Rated Corporate Bond Yields June 2021-November 2022

A Rated Bond Yields represented by the Yield to Worst on the US Aggregate Bond: A Index, BBB Rated Bond Yields represented by the Yield to Worst on the US Aggregate Bond: BBB Index, Source: Bloomberg, as of 11/30/23
Click the (i) below to read a text description of this chart or download a PDF.
Market Pulse summary: Fixed income
The year ahead is likely to be one in which fixed income investors can benefit most from locking in yields on intermediate-term investment-grade bonds amid an environment of declining short-term rates, a flattening yield curve, and a relatively benign credit environment.
U.S. stocks
U.S. stocks appear well positioned to surpass record highs in the year ahead. Tailwind catalysts include potential rate cuts by the Fed in the second half of the year, declining rates of inflation, and accelerating corporate earnings growth. We believe a realistic year-end 2024 price target for the S&P 500 to be 5,000, and within this environment we favor growth stocks over value.
Given the widely anticipated nature of a recession in 1H 2024, we believe U.S. equities are likely to handle a modest economic downturn well based on our expectations of lower interest rates, corresponding earnings acceleration in 2H 2024, and the steep declines equity markets incurred in 2022 and have yet to fully recover.
The rising roller coaster
Major Stock Indexes Seek Full Bear Market Recovery

Source: Bloomberg. As of: 11/30/23
Indexes are unmanaged and an investor can not invest directly in an index. Past performance does not guarantee future results.
Click the (i) below to read a full text description and download a PDF.
We view 5,000 as a reasonable year-end 2024 price target on the S&P 500, driven by potentially improving corporate earnings growth, declining rates of core inflation, and the end of the Fed’s tightening cycle combined with potential rate cuts in 2H 2024. These factors should act as meaningful catalysts for stock prices in the year ahead.
Following close to a flat year for earnings growth in CY 2023, S&P 500 net operating income should increase during the year ahead, even in the event of a mild recession in 1H 2024. We believe S&P 500 net earnings can achieve double-digit growth in CY 2024, however it will likely be back weighted with corporate profits increasing more in the second half of the year during recovery from a potential economic slowdown in the first two quarters.
Corporate earnings growth
S&P 500® Net Operating Income Set for Highest Year of Growth Since Pandemic Recovery

Source: FactSet Earnings Insight November 17, 2023
Click the (i) below to read a text description of this chart or download a PDF.
We view overall stock valuations as reasonable given opportunities for rising earnings growth against a backdrop of declining inflation and less restrictive monetary policy from the Fed. We believe S&P 500 net operating income could achieve close to $250 in CY 2024 with double-digit earnings growth to follow in CY 2025. We therefore view an expected earnings range for CY 2025 to be $275–$280 and, given expectations of declining inflation and Fed rate cuts, believe a fair price-earnings forward multiple on CY 2025 profits to be 18x, implying a prospective year-end 2024 price range of 4,950–5,040 to which we would round the mid-point to 5,000.
S&P 500® year-end 2024 price target
| Estimated CY 2024 S&P 500 Net Operating Income (FactSet Earnings Insight November 17, 2023) | $246 |
| Potential Earnings Range in CY 2025 | $275-$280 |
| Target Forward Price/Earnings Multiple Year-End 2024 | 18x |
| Inferred Price Target Range Year-End 2024 | 4,950-5,040 |
Click the (i) below to read a text description of this chart or download a PDF.
We also reiterate our belief that the equity markets likely put in their bear market lows in October 2022 and could see a full recovery back to their previous record highs of early January 2022, perhaps occurring by as early as spring 2024. This would be based not only on a more favorable macroeconomic environment and potential earnings acceleration in 2H 2024, but also the expected recovery of stock prices back to previous record highs based on the last 10 bear markets over the past 65 years.
Assessing the bear market recovery
Prior 10 Bear Markets 1957-2020
| Bear Market Begin | Bear Market End | Months | S&P 500 Decline | Full Recovery | Months from Bear Market End to Full Recovery | Months Recover/Decline |
|---|---|---|---|---|---|---|
| Jul 15, 1957 | Oct 22, 1957 | 3.3 | -20.7% | Sep 24, 1958 | 11.2 | 0.5 |
| Dec 12, 1961 | Jul 26, 1962 | 6.5 | -28.0% | Sep 3, 1963 | 14.5 | 0.5 |
| Feb 9, 1966 | Oct 7, 1966 | 8.0 | -22.2% | May 4, 1967 | 7.0 | 0.3 |
| Nov 29, 1968 | May 26, 1970 | 18.1 | -36.1% | Mar 3, 1972 | 21.6 | 0.6 |
| Jan 11, 1973 | Oct 3, 1974 | 21.0 | -48.2% | Jul 17, 1980 | 70.5 | 1.5 |
| Nov 28, 1980 | Aug 12, 1982 | 20.7 | -27.1% | Nov 3, 1982 | 2.8 | 0.1 |
| Aug 25, 1987 | Dec 4, 1987 | 3.4 | -33.5% | Jul 26, 1989 | 20.0 | 0.6 |
| Mar 24, 2000 | Oct 9, 2002 | 31.0 | -49.1% | May 30, 2007 | 56.5 | 1.2 |
| Oct 9, 2007 | Mar 9, 2009 | 17.2 | -56.8% | Mar 28, 2013 | 49.3 | 0.9 |
| Feb 19, 2020 | Mar 23, 2020 | 1.1 | -33.9% | Aug 18, 2020 | 4.9 | 0.1 |
| Current Bear Market Recovery | 13.0 | -35.6% | 25.8 | 0.7 | ||
| Jan 3, 2022 | Oct 12, 20221 | 9.41 | 25.4%1 | (April 2024) 2 | (17.8) 2 | (0.7) 2 |
1 Assumes Bear Market Conclusion as of October 12, 2022
2 Estimate based on Historical Bear Market Averages 1957–2020
Source: "Stock Market Historical Tables: Bull and Bear Markets" Dr. Edward Yardeni, October 28, 2022
https://www.yardeni.com/pub/sp500corrbeartables.pdf
Click the (i) below to read a text description of this chart or download a PDF.
We believe this environment likely favors growth stocks over value across the market capitalization spectrum. Criteria as to why we believe growth stocks are well positioned for the year ahead include their historical outperformance versus value during years immediately following the conclusions of Fed tightening cycles most like this recent one, as well as a “scarcity of growth” factor that could play to their benefit during a pending economic downturn in 1H 2024.
In reviewing the conclusions of past historical Fed tightening cycles and the corresponding returns of U.S. equities in the year to follow, as well as the comparative performance of growth versus value stocks during that time frame, we believe there are three cycles worth noting that are most similar to the current environment. They are the Fed rate hike cycles ending in December 2018, February 1995, and February 1989. In each case, stocks generated extremely strong total returns in the year to follow with growth outperforming value.
Growth versus value following end of Fed tightening
Historical Look Back at Similar Cycles
- December 2018 Fed concludes tightening after raising Fed Funds Rate from 1.75% to 2.50%
- February 1995 Fed concludes tightening after raising Fed Funds Rate from 3.25% to 6.00%
- February 1989 Fed concludes tightening after raising Fed Funds Rate from 6.50% to 9.75%
End of Fed Tightening December 2018

End of Fed Tightening February 1995

End of Fed Tightening February 1989

Source: Bloomberg
Indexes are unmanaged and an investor can not invest directly in an index. Past performance does not guarantee future results.
Click the (i) below to read a text description of this chart or download a PDF.
Market Pulse summary: U.S. stocks
Stocks are likely to see a continued recovery as improving earnings growth and macroeconomic tailwind catalysts likely drive the major indexes to new record highs during 2024. This environment is also likely to favor growth stocks across the market capitalization spectrum.
International stocks
Global investors are likely to benefit from international developed equities as growth in advanced regions could be improving in 2H 2024 and valuations appear favorable. Eurozone stocks appear positioned for declining inflation and potential rate cuts in the second half of the year while market conditions continue to improve in Japan. Emerging markets are more challenged and investors in this asset class may consider portfolios weighted more toward India than China.
As markets enter 2024, the lost decade of relative performance for international stocks versus their U.S. counterparts continues. However, we believe global investors can still benefit from owning overseas developed equities. This is predominantly based on the ongoing valuation gap between international developed versus U.S. stocks and what could be some level of convergence within that differential during 2024, as well as what also could be a turn toward more accommodative monetary policy at global central banks.
Valuation gap widens
Trailing 12-Month Price-Earnings Multiple S&P 500® vs. EAFE 2013-2023

Source: Bloomberg. As of: 11/30/23
Indexes are unmanaged and an investor can not invest directly in an index. Past performance does not guarantee future results.
Click the (i) below to read a text description of this chart or download a PDF.
Despite risk of lapsing into a mild recession in 1H 2024, eurozone equities could be poised for gains in the year ahead as inflation has recently receded to a two-year low and the European Central Bank (ECB) could embark upon cutting rates in 2H 2024. This might present a situation in which markets will begin to discount a combination of declining interest rates and improving economic growth in CY 2025 against a backdrop of sub-3% headline inflation, all of which could be well received by the markets following 10 consecutive ECB key interest rate increases over the past 18 months. Therefore, eurozone stocks could be well positioned for the year ahead.
Eurozone inflation declines materially
Eurozone CPI October 2022-October 2023

As of 10/31/23, Source: Eurostat
Click the (i) below to read a text description of this chart or download a PDF.
As the Nikkei 225 now stands within eyesight of its record high achieved almost 35 years ago, we believe market-oriented changes in Japan could continue to provide opportunities for international investors. Specifically, a concerted effort by the Tokyo Stock Exchange (TSE) to increase valuations of publicly traded companies could be a continuing catalyst for Japan equities. Historically, Japanese companies have maintained a strong bias toward holding cash resulting in lower price-book valuations versus other regions. However, upcoming listing requirements could soon force companies trading below book value to submit plans to the TSE as to how to improve capital management. This could result in increasing dividend payments and/or stock buyback activity on a widespread basis, likely proving favorable for the Japan equity markets.
The long road back for Japan equities
Nikkei 225 December 1989-November 2023

Source: Bloomberg. As of: 11/30/23
Indexes are unmanaged and an investor can not invest directly in an index. Past performance does not guarantee future results.
Click the (i) below to read a text description of this chart or download a PDF.
Emerging markets could require patience throughout 2024 in large part due to ongoing challenges in China, where declining real estate markets and rising youth unemployment are hindering growth opportunities. We view India as perhaps the most appealing economy within this asset class where recent GDP growth has exceeded 7%. For these reasons, we believe emerging markets portfolios are likely best positioned with higher allocations to India and lower weightings in China.
Emerging markets
Divergence of Growth India vs. China

GDP as of 9/30/23. Source - China GDP: National Bureau of Statistics of China; India GDP: Central Statistics Office India. Forecasts as of 11/30/23. Source: Bloomberg
Click the (i) below to read a text description of this chart or download a PDF.
Market Pulse summary: International stocks
Global investors stand to benefit from current valuation entry points of international developed stocks based on potentially improving economic growth and what could be more accommodative central bank monetary policy both beginning in 2H 2024.
Portfolio positioning 2024
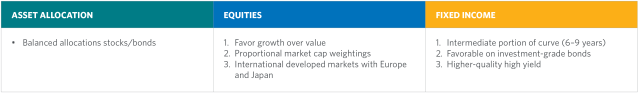
- We favor a balanced allocation of stocks and bonds given the attractive yields of intermediate-term investment-grade bonds and expected high single-digit to low double-digit total returns on stocks over the upcoming year.
- Within stocks we favor large cap over mid and small cap and growth over value. This in large part is based on a more constructive environment for growth stocks driven by declining inflation, a “scarcity of growth” factor during a potential 1H 2024 economic downturn, and Fed rate cuts during 2H 2024.
- For global equity investors, we favor developed markets over emerging markets with portfolios more focused on Europe and Japan. Within emerging markets, we would focus weightings more on India and less on China.
- For fixed income investors, we favor the intermediate portion of the yield curve in the maturity range of six to nine years as best to lock in yield and mitigate both reinvestment rollover risk and duration-based yield curve steepening price risk.
- From a credit perspective, we favor investment-grade bonds as the best risk-reward profile given current yields close to multiyear highs and their ability to fully weather an economic slowdown in 1H 2024.
- While high-yield bonds are also providing income at close to multiyear highs and will likely still generate positive total returns, we view their overall risk-return profile below that of investment grade due to greater economic sensitivity heading into a slowdown.
*The above strategy overview is intended to illustrate major themes for the identified period. No representation is being made that any particular account, product or strategy will engage in any or all of the themes.

Thomas R. Wald, CFA®
Chief Investment Officer Of Transamerica Asset Management, Inc.
Chief Investment Officer Of Transamerica Asset Management, Inc.
About the author
Tom is the Chief Investment Officer of Transamerica Asset Management, Inc., the mutual fund arm of Transamerica. Tom has more than 30 years of investment management experience and has managed large mutual fund portfolios and separate accounts.
As a member of the senior management team, Tom heads Transamerica Asset Management’s thought leadership efforts and provides perspectives to advisors, clients, the media, and general public. He writes and publishes Transamerica’s Market Outlook and other relevant commentary. He also heads Transamerica’s mutual fund sub-adviser selection and monitoring process, as well as product management. Tom holds a bachelor's degree in political science from Tulane University and an MBA in finance from the Wharton School at the University of Pennsylvania.
Learn more about our mutual funds and get the latest advisor resources.
Index Definitions
The Bloomberg US Aggregate Bond Index measures investment grade, U.S. dollar denominated, fixed-rate taxable bonds, including Treasurys, government related and corporate securities, as well as both mortgage- and asset-backed securities.
The Bloomberg US High Yield Index covers the universe of fixed rate, non-investment grade debt. Eurobonds and debt issues from countries designated as emerging markets (sovereign rating of Baa1/BBB+/BBB+ and below using the middle of Moody’s, S&P, and Fitch) are excluded, but Canadian and global bonds (SEC registered) of issuers in non-EMG countries are included.
The Bloomberg Municipal Index consists of a broad selection of investment-grade general obligation and revenue bonds of maturities ranging from one year to 30 years. It is an unmanaged index representative of the tax-exempt bond market.
The Bloomberg US Corporate Investment Grade Index is an unmanaged index consisting of publicly issued U.S. Corporate and specified foreign debentures and secured notes that are rated investment grade (Baa3/BBB or higher) by at least two ratings agencies, have at least one year to final maturity and have at least $250 million par amount outstanding. To qualify, bonds must be SEC-registered.
The 10-Year U.S. Treasury bond is a U.S. Treasury debt obligation that has a maturity of 10 years.
The Dow Jones Industrial Average is a price-weighted average of 30 actively traded blue-chip U.S. stocks.
The MSCI EAFE Index (Europe, Australasia, Far East) is a free float-adjusted market capitalization index that is designed to measure the equity market performance of developed markets, excluding the U.S. & Canada.
The MSCI Emerging Markets Index is a free float-adjusted market capitalization index that is designed to measure equity market performance in the global emerging markets.
The Russell 1000 Growth Index® measures the performance of those Russell 1000 companies with higher price-to-book ratios and higher forecasted growth values.
The Russell 1000 Value Index® measures the performance of those Russell 1000 companies with lower price-to-book ratios and lower forecasted growth values.
The Russell 2000 Index® measures the performance of the 2,000 smallest companies in the Russell 3000 Index.
The S&P 500 Index is widely regarded as the best single gauge of the U.S. equities market. The index includes a representative sample of 500 leading companies in leading industries of the U.S. economy. The S&P 500 Index focuses on the large-cap segment of the market; however, since it includes a significant portion of the total value of the market, it also represents the market.
The Nikkei 225 stock index is a price-weighted index composed of Japan's top 225 blue-chip companies traded on the Tokyo Stock Exchange. The Nikkei is equivalent to the Dow Jones Industrial Average (DJIA) Index in the United States.
Indexes are unmanaged. The figures for the index reflect the reinvestment of all income or dividends, but do not reflect the deduction of any fees or expenses which would reduce returns. Investors cannot invest directly in indexes.
Important Information
Investments are subject to market risk, including the loss of principal. Asset classes or investment strategies described may not be appropriate for all investors.
Past performance does not guarantee future results.
Fixed income investing is subject to credit rate risk, interest rate risk, and inflation risk. Credit risk is the risk that the issuer of a bond won’t meet their payments. Inflation risk is the risk that inflation could outpace a bond’s interest income. Interest rate risk is the risk that fluctuations in interest rates will affect the price of a bond. Investing in floating rate loans may be subject to greater volatility and increased risks.
Equities are subject to market risk meaning that stock prices in general may decline over short or extended periods of time.
Growth stocks typically are particularly sensitive to market movements and may involve larger price swings because their market prices tend to reflect future expectations. Growth stocks as a group may be out of favor and underperform the overall equity market for a long period of time, for example, while the market favors “value” stocks.
Value investing carries the risk that the market will not recognize a security’s intrinsic value for a long time or that an undervalued stock is actually appropriately priced.
Investments in global/international markets involve risks not associated with U.S. markets, such as currency fluctuations, adverse social and political developments, and the relatively small size and lesser liquidity of some markets. These risks may be greater in emerging markets.
The COVID-19 pandemic has caused substantial market disruption and dislocation around the world including the U.S. Economies and financial markets throughout the world are increasingly interconnected. Economic, financial, or political events, trading and tariff arrangements, terrorism, technology and data interruptions, natural disasters, and other circumstances in one or more countries or regions could be highly disruptive to, and have profound impacts on, global economies or markets.
The information included in this document should not be construed as investment advice or a recommendation for the purchase or sale of any security. This material contains general information only on investment matters; it should not be considered as a comprehensive statement on any matter and should not be relied upon as such. The information does not take into account any investor’s investment objectives, particular needs, or financial situation. The value of any investment may fluctuate. This information has been developed by Transamerica Asset Management, Inc., and may incorporate third-party data, text, images, and other content to be deemed reliable.
Comments and general market-related projections are based on information available at the time of writing and believed to be accurate; are for informational purposes only, are not intended as individual or specific advice, may not represent the opinions of the entire firm and may not be relied upon for future investing. Investors are advised to consult with their investment professional about their specific financial needs and goals before making any investment decisions.
Transamerica Asset Management, Inc. (TAM) is an SEC-registered investment adviser that provides asset management, fund administration and shareholder services for institutional and retail clients. The funds advised and sponsored by TAM include Transamerica Funds and Transamerica Series Trust. Transamerica Funds and Transamerica Series Trust are distributed by Transamerica Capital, Inc. (TCI), member FINRA. TAM is an indirect wholly owned subsidiary of Aegon Ltd., an international life insurance, pension, and asset management company.
1801 California Street, Suite 5200, Denver, CO 80202, USA