
In this article we review:
- The composition of the Russell 1000® Index and opportunity to take advantage of mispricing from within
- The historic valuation discount of mid-cap equities relative to mega cap
- The attractive long-term risk/reward profile and outperformance of the mid-cap equity asset class
While research points to an evergreen investment case for mid-cap equities, the narrow mega-cap-led market of 2023 has resulted in what appears to be an opportune window to be considering mid caps today.
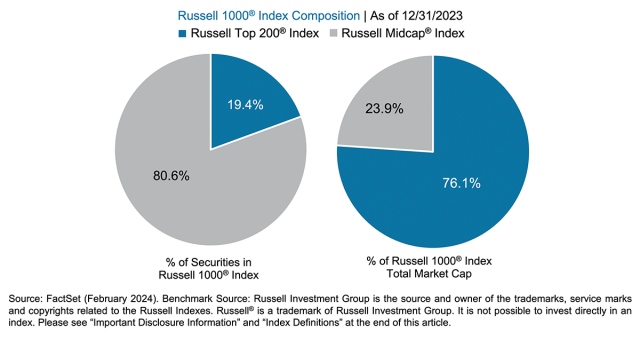
The unbalanced and misunderstood composition of the Russell 1000® Index
Given the narrow market leadership of mega caps in 2023, we believe there is a compelling case to be made for looking at mid-cap equities, particularly within a large-cap lens.
While the Russell 1000 Index serves as a proxy for large-cap stocks, many are surprised to find that mid caps are incorporated here as well. Within the Russell 1000, the largest 200 companies make up what is known as the Russell Top 200® Index, while the bottom 800 are represented by the Russell Midcap® Index. Despite mid caps making up approximately 80% of the Russell 1000 by name count, on a market-cap weighted basis they represent less than 25% and leave most investors underexposed.
The Russell 1000 Index was up 26.53% in 2023, but the brunt of that performance can be attributed to the Russell Top 200 Index, which appreciated 29.85%. The other 800 names, or the Russell Midcap Index, posted a 17.23% return. What this leaves us with within the Russell 1000 are particularly higher valuations for the largest 200 companies versus the bottom 800. Looking through a value lens, the Russell Midcap® Value Index trades at a more reasonable price-to-cash flow (P/CF) level — a measure of how much cash a company generates compared to its stock price.
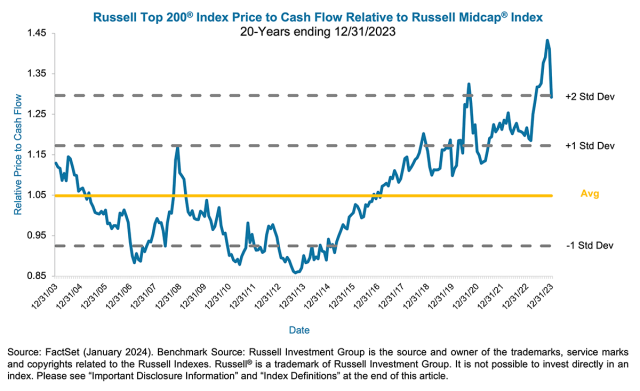
Larger-cap equities reached their 20-year high in relative valuation premium versus mid caps during the fourth quarter of 2023.
Given the recent outperformance described above, the Russell Top 200 Index reached its highest P/CF valuation premium over the past 20 years versus the Russell Midcap Index in October of 2023, before retreating over the final two months of the year.
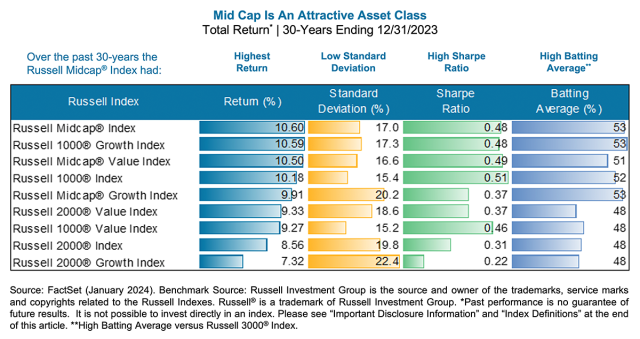
Mid-cap equities have outperformed over longer time horizons and in various market cycles.
Over the past 30 years, the Russell Midcap Index is the best-performing Russell style (out of nine), followed by the Russell 1000 Growth, given its outsized relative outperformance in recent years, and the Russell Midcap Value Index. The mid-cap style box has also provided investors with a high risk-adjusted relative return.
In addition, the Russell Midcap Index’s batting average, or percentage of outperforming months versus the broad U.S. market (Russell 3000) during the period, is tied for the highest of all the styles. Due to its narrow market leadership and current valuation, investors have been granted an opportunity to devote capital to an outperforming asset class at a historically significant discount to its larger-cap subset.
Looking back at the past 30 years, the market has experienced an array of environments, encompassing up/down, value/growth, and fundamental/speculative. These varying conditions highlight the resiliency of the mid-cap asset class, which has historically offered small-cap-like characteristics (less followed by Wall Street analysts and higher growth), with large-cap-like risk profiles (diversified business lines, ease of access to financing, and experienced management teams).
In conclusion, the narrow market leadership of 2023 provides investors with a compelling entry point to allocate to a historically market-leading asset class at an attractive discount. Furthermore, mid caps have proven to outperform in a variety of market environments while providing a high risk-adjusted return. The above summarizes why investors should consider this asset class as it appears to be an opportune time to allocate to mid-cap equities, value in particular.
About the Author
Brett Hawkins is co-portfolio manager for the Transamerica Mid Cap Value Opportunities and Transamerica Small/Mid Cap Value funds. Prior to joining TSW in 2001, he was an assistant vice president of equity research with First Union Securities having previously worked at Arthur Andersen LLP as an audit and business advisory senior associate. Brett is a graduate of the University of Richmond and received his MBA from the University of Virginia, Darden School. In addition, he holds the Chartered Financial Analyst® designation.
Related Funds
Transamerica Mid Cap Value Opportunities
Transamerica Small/Mid Cap Value
Index Definitions
The Russell Top 200® Index measures the performance of the largest cap segment of the U.S. equity universe. The Russell Top 200® Index is a subset of the Russell 3000® Index. It includes approximately 200 of the largest securities based on a combination of their market cap and current index membership and represents approximately 68% of the Russell 3000® Index.
The Russell 1000® Index measures the performance of the large-cap segment of the U.S. equity universe. It is a subset of the Russell 3000® Index and includes approximately 1,000 of the largest securities based on a combination of their market cap and current index membership.
The Russell Midcap® Index measures the performance of the mid-cap segment of the U.S. equity universe. The Russell Midcap® Index is a subset of the Russell 1000® Index. It includes approximately 800 of the smallest securities based on a combination of their market cap and current Index membership.
The Russell 1000 Growth Index® measures the performance of those Russell 1000 companies with higher price-to-book ratios and higher forecasted growth values.
The Russell 3000® Index measures the performance of the largest 3,000 U.S. companies representing approximately 96% of the investable U.S. equity market, as of the most recent reconstitution.
The Russell Midcap® Value Index measures the performance of those Russell Midcap® Index companies with lower price-to-book-ratios and lower forecasted growth values. The Index is reconstituted annually to ensure larger stocks do not distort the performance and characteristics of the midcap value market.
The Russell Midcap® Growth Index measures the performance of the mid-cap growth segment of the U.S. equity universe. It includes those Russell Midcap® Index companies with relatively higher price-to-book ratios, higher I/B/E/S forecast medium term (2-year) growth and higher sales per share historical growth (5 years).
The Russell 1000® Value Index measures the performance of the large-cap value segment of the U.S. equity universe. It includes those Russell 1000 companies with relatively lower price-to-book ratios, lower I/B/E/S forecast medium term (2-year) growth and lower sales per share historical growth (5 years).
The Russell 2000® Index measures the performance of the small-cap segment of the U.S. equity universe. The Russell 2000 Index is a subset of the Russell 3000® Index and includes approximately 2,000 of the smallest securities based on a combination of their market cap and current index membership.
The Russell 2000® Growth Index measures the performance of the small-cap growth segment of the U.S. equity universe. It includes those Russell 2000 companies with relatively higher price-to-book ratios, higher I/B/E/S forecast medium term (2-year) growth and higher sales per share historical growth (5 years).
The Russell 2000® Value Index measures the performance of the small-cap value segment of the U.S. equity universe. It includes those Russell 2000® companies with relatively lower price-to-book ratios, lower I/B/E/S forecast medium term (2-year) growth and lower sales per share historical growth (5 years).
Past performance is not indicative of future results. It is not possible to invest directly in an index, which also does not include the application of fees.
Important Information
All opinions, estimates, projections, and security selections contained herein are those of the sub-adviser. It does not constitute investment advice and should not be used as a basis for any investment decision.
Mutual funds are subject to market risk, including loss of principal. Past performance is not indicative of future results.
Mutual funds are sold by prospectus. Before investing, consider the funds' investment objectives, risks, charges, and expenses. This and other important information is contained in the prospectus. Please visit transamerica.com or contact your financial professional to obtain a prospectus or, if available, a summary prospectus containing this information. Please read it carefully before investing.
Investing in mid-sized companies involves greater risk than is customarily associated with more established companies. The securities of mid-sized companies are subject to higher volatility than larger, more established companies. The prices of securities the sub-adviser believes are undervalued may not appreciate as anticipated or may go down. Value investing carries the risk that the market will not recognize a security’s intrinsic value for a long time or that an undervalued stock is actually appropriately priced.
During periods of market disruption (e.g., COVID-19), which may trigger trading halts, the fund's exposure to the risks described in the prospectus will likely increase. As a result, the value and liquidity of the fund's investments may be negatively affected.
Transamerica Funds are advised by Transamerica Asset Management, Inc. (TAM) and distributed by Transamerica Capital, Inc. (TCI), member of FINRA.
1801 California St., Suite 5200, Denver, CO 80202
Transamerica Companies and TSW are not affiliated companies.
© 2024 Transamerica Corporation. All Rights Reserved.


