
In this article, we review:
- January data that shows the U.S. economy expanding in the fourth quarter of 2024, but at a slower pace
- The Fed’s shift to wait-and-see mode, and market expectations for future rate cuts
- The performance of short duration, core bonds, high yield, floating rate bank loans, and emerging market debt
Macro & Rates
Data releases showed the economy continued to expand in the fourth quarter, albeit at a somewhat slower pace. According to the Bureau of Economic Analysis’ preliminary estimate, gross domestic product (GDP) came in at 2.3% annualized rate in the fourth quarter, which was below both the third quarter’s 3.1% rate and the 2.7% consensus estimate. Meanwhile, on the inflation front, the consumer price index (CPI) rose 0.4% in December from the previous month. On a year-over-year basis, the CPI ticked up to 2.9% in December from 2.7% in November.
Payroll data showed the economy added 256,000 jobs in December, better than both the 154,000 jobs economists expected and November’s revised 212,000 reading.
Investors continued to keep a close eye on interest rates. At its January meeting, the Federal Reserve (Fed) left its benchmark interest rate at between 4.25% and 4.50%. At a news conference after the meeting, Fed Chairman Jerome Powell said that with interest rates now “significantly less restrictive” than they were when the Fed began cutting rates, “we do not need to be in a hurry to adjust our policy stance.”
GDP annualized % change
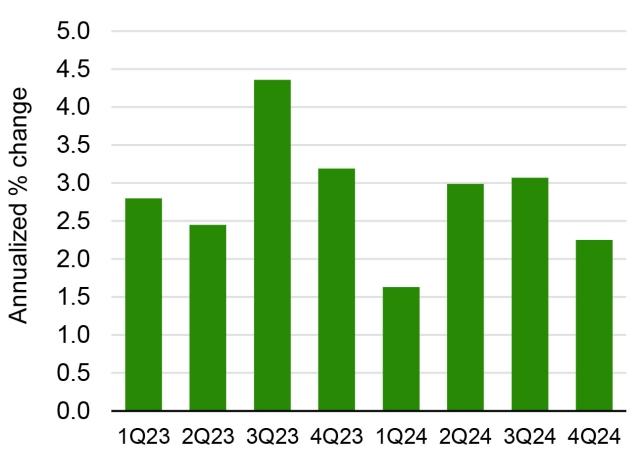
Sources: Bureau of Economic Analysis, Moody’s Analytics. Data as of January 2025.
Short Duration
With the Fed shifting to wait-and-watch mode, the markets moved on to pricing closer to two interest rate cuts before the end of 2025. The front end of the curve sold off earlier in the month after strong Job Openings and Labor Turnover Survey (JOLTS) results and Institute of Supply Management (ISM) numbers but since then has stabilized with the two-year hovering around the 4.2% area. The macroeconomic data continues to show an economy that is still in good shape but nevertheless cooling with the fourth quarter GDP numbers coming in lower than the previous quarter’s.
Risk assets continue to perform well. As expected, investment-grade markets had a strong new issuance calendar that took the month-to-date and year-to-date tallies close to $200 billion and the demand continues to be insatiable. This has helped the spreads stay resilient. January supply was mostly concentrated in financials. Syndicates expect to issue an additional $160-180 billion in February after the earnings blackout from industrials. Fourth quarter bank earnings showed asset quality metrics remained stable and management teams do not expect major deterioration or improvement from the current setup barring office commercial real estate. Early indication from the industrial earnings seem to paint a similar benign picture.
Short-dated credits outperformed this month. The ICE BofA 1-3 Year US Corporate Index closed Thursday, January 30, at 52 basis points (bps) option-adjusted spread (OAS), 4 bps tighter from the prior month. The index yield to worst (YTW) is 4.76%, which is 8 bps lower than the previous month. This resiliency is expected to continue as investors continue to prioritize all-in yield over spreads.
Core Bonds
The Fed decided to stand pat after consecutive cuts, indicating it will be keenly tuned to the incoming data to decide on the timing of future cuts. Despite a never-ending barrage of headlines from the new administration, we are yet to get clarity around tariffs. The rates markets have not changed much since the beginning of the year despite intra-month volatility, which took the 10-year to 4.80% and the 30-year to 5.0%. On a month-over-month basis, the curve bell flattened, with the belly rallying better than the wings with the 10-year back to the 4.50% range.
News on the DeepSeek R1 AI model earlier this week had marginal impact on spreads with some technology names trading a few bps wider but ending the week mostly unchanged.
The Bloomberg US Credit Index ended Thursday, January 30, at 76 bps OAS, 1 bp tighter for the month. The range was incredibly tight over the month sitting between 74 and 78 bps. The YTW currently sits at 5.24%. YTD, the index had a total return of 0.75% and an excess return to duration-matched Treasurys of 0.11%. Fund flows continue to remain positive. Lipper indicates investment-grade funds continue to see strong inflows at a steady pace of $2+ billion every week.
High Yield
The high-yield market held steady in January and the Bloomberg US High Yield Index delivered a solid return of 1.37%. The market was supported by strong technicals with light supply and renewed inflows as well as positive macro signals and a decent start to the earnings season. During the month there was no shortage of headlines as President Donald Trump enacted various executed orders and created a flurry of headlines around potential U.S. fiscal policy changes. The release of DeepSeek’s new AI model also prompted weakness in the equity markets, particularly the technology sector. However, the high-yield market held steady and was largely unphased by the broader noise. The Fed meeting was also in focus as the committee held rates steady in January. Earnings seasons kicked off mid-month, and although there have been few high-yield reporters so far, the results have generally met or beat expectations.
For the month, the Bloomberg US High Yield Index gained 1.37%. All rating categories performed similarly. CCCs gained 1.54%, followed by B-rated bonds at 1.42% and BBs returned 1.28%. Spreads remain around tight levels and the yield to worst on the index ended at 7.20% as of January 31.
In terms of market technicals, the primary market started the year with a softer tone. Despite high hopes for an uptick in primary issuance to help kick start the year, new issuance largely underwhelmed expectations, although activity picked up toward month-end. New issuance totaled $22.1 billion for the month of January, which compares to a monthly average of $30 billion historically. On the demand side, inflows returned to the market with $1.5 billion of inflows during January. The lack of supply and ongoing demand for high-yield bonds led to another month of supportive technicals.
Floating Rate Bank Loans
For the month ending Thursday, January 30, the loan market grinded higher throughout January and ended up 17 cents on the S&P UBS Leveraged Loan Index to stand at a $96.54 dollar price. The three-year yield filtered a touch lower to end at 8.74%, as loan spread tightening was offset by an expected higher path of SOFR going forward as inflation proves stickier and the Fed is expected to stay on hold for a bit longer.
Primary markets continued to steal the show with over $200 billion of launches during the month, a new record once again for the broadly syndicated loan market. Re-pricings are taking around 50 bps off the average spread when they happen and, unfortunately, that activity is dominating the calendar still. There were a few new money, leveraged buyouts and mergers/acquisition deals sprinkled in, but not enough paper to upset the current supply/demand technical that exists. As such, managers have been forced to buy loans at higher prices in the secondary, keeping most performing single B and BB names above par or even toward $101 if there is soft call protection left. Earnings are still largely coming through OK, although we’ll see more earnings impact on names in February as year-end reporting is a bit delayed compared to other quarters throughout the year.
Loan funds saw large inflows in January, especially for ETF products on the rates higher-for-longer theme. Collateralized loan obligations (CLOs), which are always slow to build after the new year, started pricing in a hurry during the last two weeks of January and street prognosticators expect the ongoing pace of record issuance to continue as managers and CLO equity owners take advantage of lower CLO liability spreads.
Emerging Markets Debt
Emerging market debt (EMD) performed generally well in the first month of the year despite growing trade rhetoric following President Trump’s inauguration and further rowing back of Fed easing expectations. The absence of broad sweeping tariffs on day one offered some relief and regional political developments aided a continuation of the CCC-rated outperformance, which has been an ever-present theme within EMD since the latter months of 2023.
EMD returned 1.4% in January, supported by 9 bps of credit spread tightening. Lebanon continued its rally as parliament elected its first president in two years and broader de-escalation efforts were reflected in Egypt, Iraq, and Jordan. Ecuador bonds reached a three-year high as polling ahead of the presidential election points to the re-election of market-favored Daniel Noboa. The combination of resumed African sovereign debt issuance and higher oil prices following former President Joe Biden’s parting sanctions on Russia’s shadow shipping fleet has supported outperformance by low-rated African credits. There were no large underperformers in January and December’s fiscal-led widening in Brazil and Romania was partially recovered, particularly in the former. Overall, credit performance has come amid further dollar strengthening that may gain short-term momentum and weigh on EMD if there is not a solution to prospective tariffs being enforced in February.
Past performance is not indicative of future results. It is not possible to invest directly in an index, which also does not include the application of fees. Yield to worst (YTW) is a measure of the lowest possible yield that can be received on a bond that fully operates within the terms of its contract without defaulting.
Sub-Adviser Page
Index Definitions
The 10-Year U.S. Treasury bond is a U.S. Treasury debt obligation that has a maturity of 10 years.
The Bloomberg Emerging Markets Aggregate Index measures the performance of hard currency Emerging Markets (EM) debt, including fixed and floating-rate U.S. dollar-denominated debt issued from sovereign, quasi-sovereign, and corporate EM issuers.
The Bloomberg US Aggregate Bond Index is an unmanaged index used as a general measure of market performance.
The Bloomberg US Corporate High Yield Bond Index measures the USD-denominated, high-yield, fixed-rate corporate bond market.
The Bloomberg US Corporate Index measures the investment-grade, fixed-rate, taxable corporate bond market.
The Bloomberg US Government Bond Index is comprised of the U.S. Treasury and U.S. Agency Indexes. The index includes USD-denominated, fixed-rate, nominal U.S. Treasurys and U.S. agency debentures (securities issued by U.S. government-owned or government-sponsored entities, and debt explicitly guaranteed by the U.S. government).
The Credit Suisse Leveraged Loan Index tracks the investable market of the U.S. dollar-denominated leveraged loan market.
The ICE BofA 1-3 Year US Corporate Index, a subset of the ICE BofA US Corporate Master Index, tracks the performance of U.S. dollar-denominated, investment-grade-rated corporate debt publicly issued in the U.S. domestic market. This subset includes all securities with a remaining term to maturity of less than three years.
Important Information
All opinions, estimates, projections, and security selections contained herein are those of the sub-adviser. It does not constitute investment advice and should not be used as a basis for any investment decision.
Comments and general market-related projections are based on information available at the time of writing and believed to be accurate; are for informational purposes only, are not intended as individual or specific advice, may not represent the opinions of the entire firm, and may not be relied upon for future investing. Investors are advised to consult with their investment professional about their specific financial needs and goals before making any investment decisions. The value of any investment may fluctuate.
Fixed income securities are subject to risks including credit risk, interest rate risk, counterparty risk, prepayment risk, extension risk, valuation risk, and liquidity risk. The value of fixed income securities generally goes down when interest rates rise, and therefore the value of your investment in the fund may also go down. High-yield bonds tend to be volatile and more susceptible to adverse events, credit downgrades and negative sentiments. Changes in interest rates, the market's perception of the issuers and the creditworthiness of the issuers may significantly affect the value of the fund. Investing in floating rate loans may be subject to greater volatility and increased risks.
The risks of investing in foreign securities are magnified in emerging markets. Foreign and emerging market investments involve risks not associated with U.S. markets, such as currency fluctuation, adverse social and political developments, and the relatively small size, lower trading volumes and lesser liquidity of the markets.
* Aegon Asset Management US (Aegon AM US) is the marketing name of the sub-adviser. The legal entity name of the sub-adviser is Aegon USA Investment Management, LLC.
Aegon USA Investment Management, LLC is an affiliate of Aegon companies. Transamerica companies are part of the Aegon group.
Securities offered through Transamerica Capital, LLC, member FINRA, 1801 California Street, Denver, CO 80202.
© 2025 Transamerica Corporation. All Rights Reserved.


